 Claude Tools
Usage limits arrive as a surprise.
You are deep in a session and the banner lands: you have burned through your window. Claude Code tells you the number only once you are near the edge, and it says nothing about pace. Two people can both be at 60% and be in completely different trouble: one has all day, the other will hit the wall in twenty minutes.
The Usage HUD puts that reading where you already look, the VS Code status bar, and adds the one signal the banner never gives you: whether your rate of spend will actually reach the reset, or run out well before it.
The active window's model
Which Claude model this window is talking to, resolved per window and tracked through mid-session switches in about 150 milliseconds. No global default is ever shown.
Every usage window
The 5-hour, 7-day, and scoped model windows, each colored green to red against clear thresholds, from plenty of room to right at the limit.
Burn rate, not just level
A second signal on the reset countdown: are you on track to land right at the limit when the window resets, or heading there far too early?
Private by design
It uses your own Claude Code login to read your usage, and caches it so calls stay rare. Nothing goes to any third party, and your token is never stored by the extension.
Four surfaces, one reading.
The same numbers, rendered for four different moments: a glance, a hover, a pinned widget, and a full breakdown.
| Surface | What it is | How to reach it | Always visible |
|---|---|---|---|
| Status bar (C1) | A composite of adjacent items parked toward the center of the status bar | Bottom bar, out of the box | Yes |
| Hover tooltip (C1b) | A markdown card with emoji meters, burn bullets, and live sessions | Hover the status bar | On hover |
| Floating HUD (C2) | A compact always-on-top widget with smooth colored meters | Command: Pop Out Floating HUD | Yes, floats on top |
| Panel dashboard (C3) | The full two-column breakdown with every live session | The Usage tab in the panel | When its tab is open |
Self-contained. The only requirement is Claude Code, installed and logged in. The Usage HUD reads your existing Claude Code login token from your machine's credential store and calls the same usage endpoint the built-in /usage panel uses. Nothing is sent to any third party, and your token is never stored by the extension. On macOS, the first run may show a one-time keychain permission prompt.
Every number carries two signals.
Understanding them makes the whole HUD legible. One signal is how full a window is. The other is whether you are going to make it to the reset. They live in different places and, on purpose, they can disagree.
Signal A · usage level
< 70%70%80%90%Signal B · burn rate
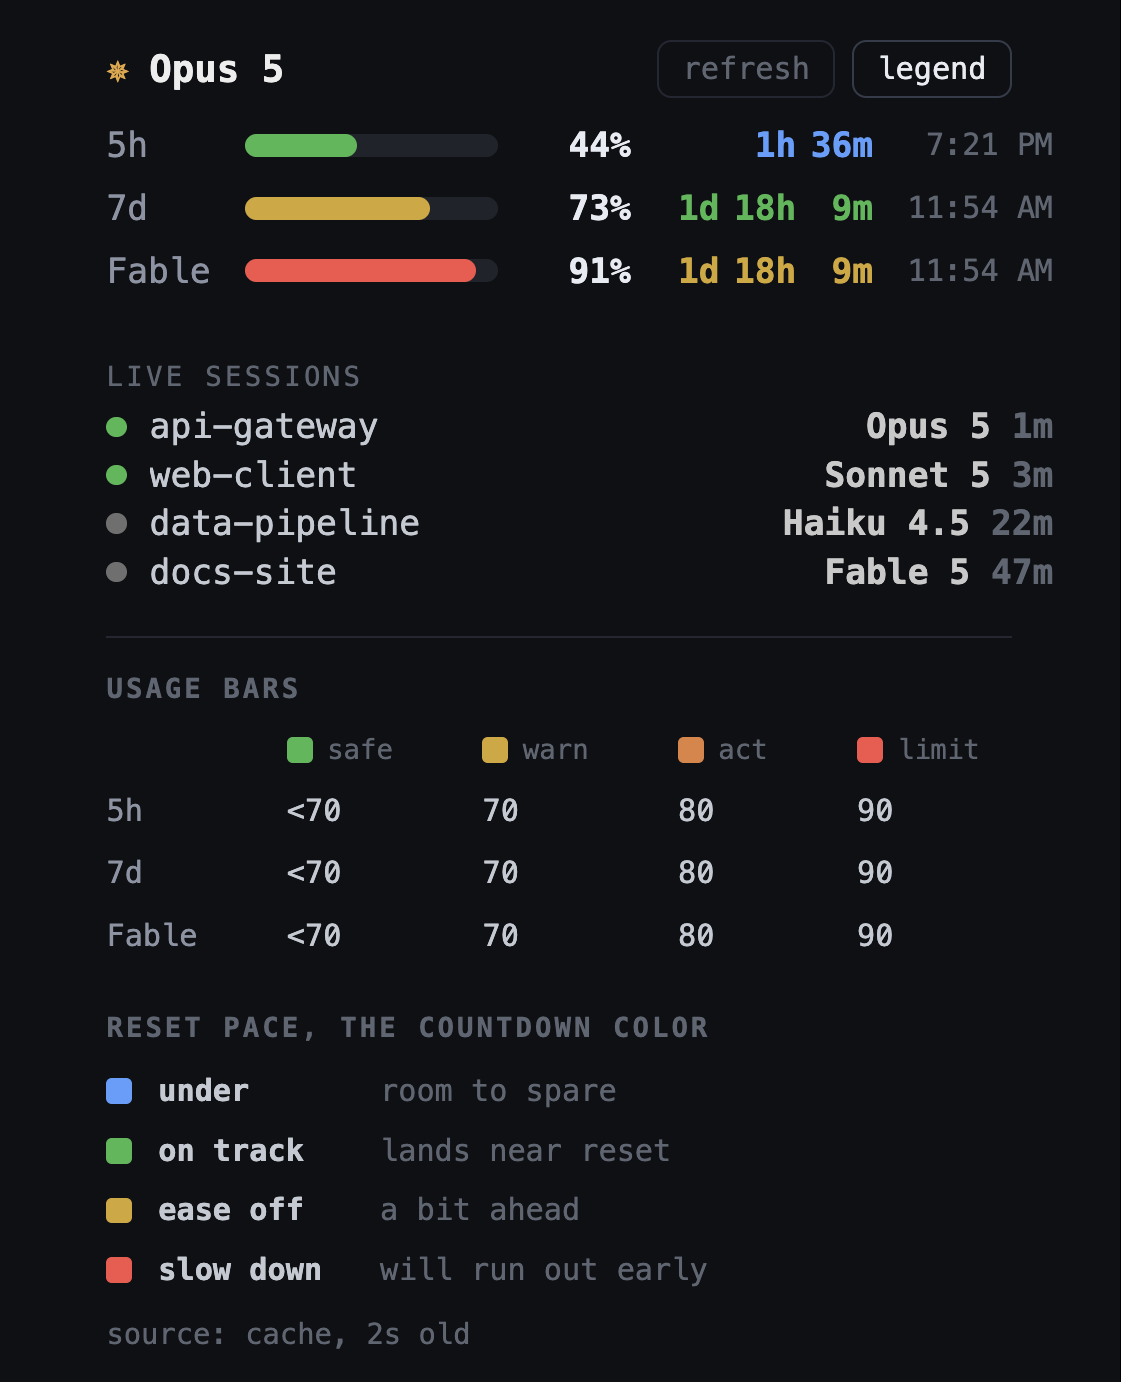
r < 0.750.75 to 1.151.15 to 1.6r > 1.6Why they can disagree, and why that is the point. Every screenshot on this page shows all three windows disagreeing at once, because that is the ordinary case rather than an edge case. The Fable window is at 91%: the bar is red, almost full, yet its countdown is only yellow, because with most of the week still to run that fill is merely a little ahead of pace, not a crisis. Meanwhile the 7-day window is at 73%, a yellow bar, with a green countdown: fuller than Fable in mood, but spending at exactly the rate that lands on the reset. Level tells you where you are. Pace tells you where you are going, and reading only one of them is how a limit arrives as a surprise. A short early-window guard holds pace at "on track" right after a reset, before enough time has elapsed to judge a rate at all.
The glance.
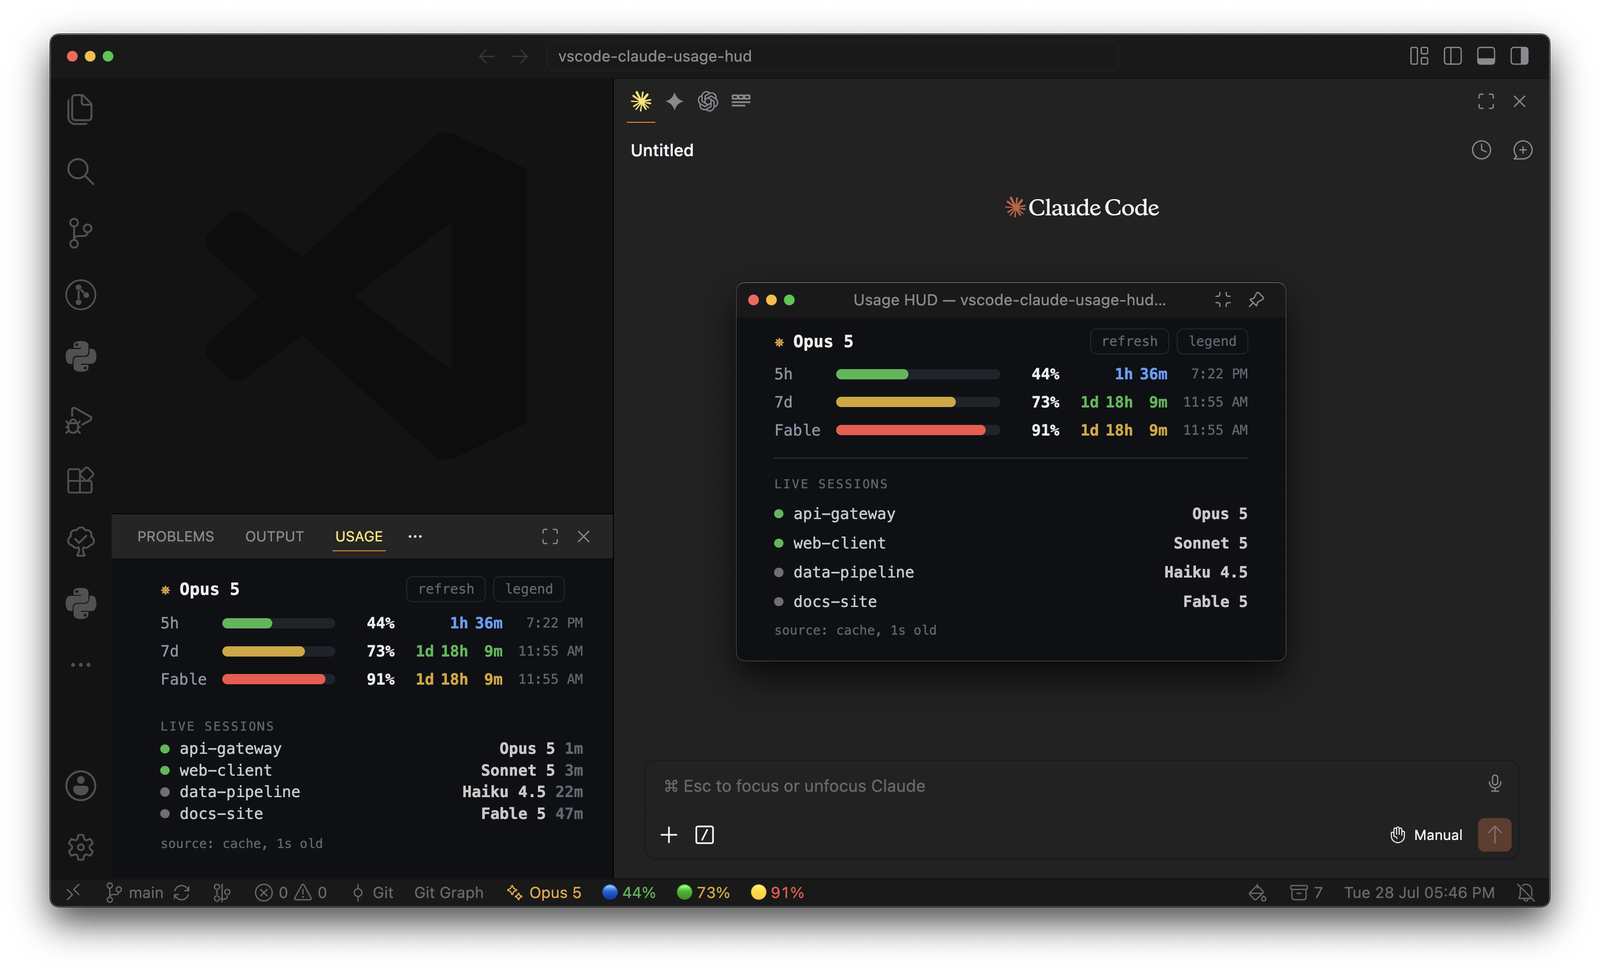
A group of adjacent items sits toward the center of the status bar, past the git items. Up to five segments: the model, then 5h, 7d, and up to two scoped models. Here is a real editor with the HUD running, showing the status bar along the bottom edge, the Usage panel docked at the lower left, and the floating HUD over the editor, all reading the same numbers at the same instant.
Read it left to right
 1
2
3
4
1
2
3
4
✦ Opus 5 , the model this window is using right now. Gold, and shown only when a live session actually resolves. If none does, the segment disappears rather than falling back to a guess.
The dot is Signal B, the pace. Blue on the 5-hour window means "under": barely a third of the way through the window and only 44% spent, so there is room to go faster.
44% , the number's color is Signal A, the level. Green, because it is under the 70% mark. The dot beside it and the number it precedes are answering two different questions.
91% on the Fable window, red because it is past 90%, but its dot is only yellow. Nearly full, yet not spending fast enough to be in trouble before the week turns over. This pairing is the whole reason there are two signals.
This is the micro density, where the dot carries the pace and the number's color carries the level. The four densities below trade that compactness for detail.
Four densities.
The same reading, from a bare pulse to the full countdown. Switchable live from the status bar click, or the density setting.
The same instant in all four, matching the screenshots above and below. micro is what ships, because a status bar is shared with source control, problems and the language mode, and it carries both signals anyway: the dot is the pace, the number's colour is the level. verbose trades width for the reset countdowns. Switching is one click on the status bar item.
The card and the widget.
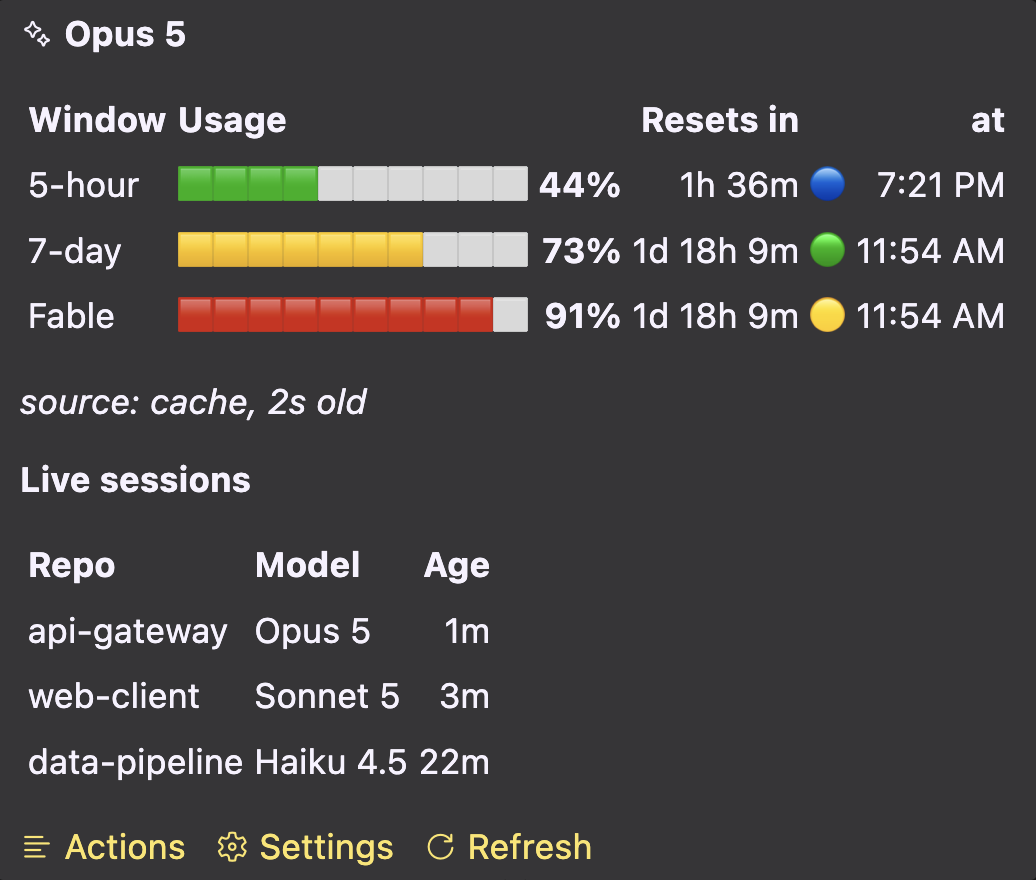
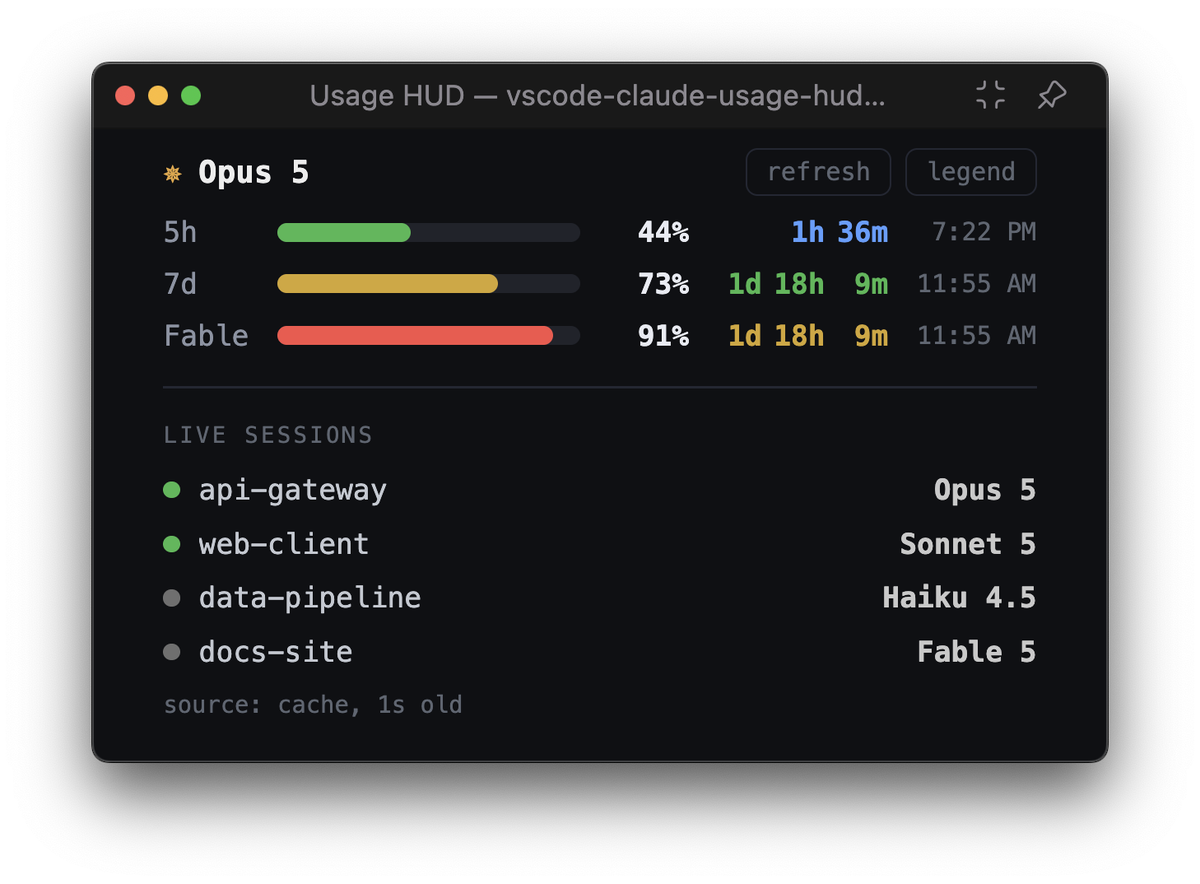
Hover the status bar for a markdown card that carries color through emoji, the one medium that cannot do CSS. Pop out the floating HUD to keep a smooth, always-on-top widget over everything you do.
The legend travels with the tool.
Nothing on this page is knowledge you have to keep. The legend button opens the same two tables inside the extension: the usage ladder for the bars, and the four pace colours for the countdown. If this page and the extension ever disagree, the extension is right.
Everything local, everything cheap.
No accounts, no setup, no third parties, and no runtime dependencies. It uses your own Claude Code login and your local session files, with its own private cache. Here is the loop.
Read the usage cache
Every poll (default 60 seconds, floor 15) it checks its own cache first; when that is stale it reads your usage from the same endpoint Claude Code's /usage panel uses, authorized with your own login token, then caches the result. That cache is shared across every open window, so the endpoint is hit at most about once a minute no matter how many windows you have open. A failed read falls back to the last cached value, labeled as cache, rather than erroring.
Classify into bands
One built-in ladder, 70 / 80 / 90, turns a raw percentage into a safe / warn / act / limit band and a color, so a glance tells you which zone each window is in: well clear, getting full, time to ease off, or at the wall. The same ladder applies to every window, so a colour means the same thing wherever you see it.
Resolve the active model, fast
The Claude extension exposes no API. The trick: it touches a session's transcript file the instant you open that session in the panel. So the HUD resolves the model from the newest-modified transcript in this repo's project folder, watched with a file watcher, and tracks a switch in about 150 milliseconds. VS Code's own record of the active session is flushed to disk minutes late, so it is only a fallback.
Scan for live sessions
Every 20 seconds it scans all project folders directly, one newest session per repo, filtered to activity in the last 90 minutes, reading the model and repo name from each transcript tail. Fast file stats, complete across every repo.
Emit one snapshot, paint everywhere
A single hub owns usage, model, and sessions. Any change fires one snapshot with all colors and formatting pre-computed. The status bar and both webviews subscribe and simply paint it. The webviews are dumb renderers, which is why all four surfaces always show exactly the same reading.
What refreshes, and when.
| What | Source | Cadence |
|---|---|---|
| Usage windows | your local Claude Code usage | every pollSeconds (60, floor 15), plus on change |
| Thresholds | built-in bands | applied to each reading |
| Active model | newest transcript in the project dir | on change (~150ms) plus a 1.5s safety poll |
| Live sessions | scan of all project dirs | every 20s |
Settings
density | micro / minimal / bars / verbose |
barStyle | block / shade / dot / notch / text |
statusBarBars | glyph bars in the bar itself |
alignment | left or right cluster |
pollSeconds | refresh interval, min 15 |
floatMode | window (always-on-top) or beside |
Commands
| Pop Out Floating HUD | opens the widget |
| Open Detail / Actions | the click quick pick |
| Copy Usage Report | plain text to clipboard |
| Choose Bar Style | pick a glyph |
| Choose Status Bar Density | pick a density |
| Refresh Now | force a refresh |
Built lean. TypeScript, with an empty dependencies list: no runtime npm packages at all, so what you install is this project's own code and nothing else. Everything it reads on disk, it reads read-only.